Executive Summary
Ask four different AI models to recommend CRM software in the US and Germany. The products they mention may be similar but the websites they cite to support those recommendations are almost completely different. Something gets lost between markets and it's not necessarily the product. Even for inherently global software, 81–93% of source domains are exclusive to a single country.
We tested this across several global software categories (such as CRM, cybersecurity, marketing automation, data analytics, collaboration tools) in 12 countries, 7 languages, and 4 major AI models. We analyzed more than 1 million sources in this industry to come up with the findings in this report.
For SaaS companies, technology vendors, and anyone managing AI visibility across markets, the implication is clear. A strong source presence in one country does not carry over, even for a product category that is fundamentally the same everywhere. Localized content strategies are not optional. They are the only way to appear in AI responses market by market.
Your brand authority doesn't have a passport.
Highlights
- Fewer than 1 in 10 source domains are shared between any two countries on average: even for products like Salesforce and HubSpot, the vast majority of AI-cited websites never appear in another country's results.
- 23.9% is the highest source overlap between any country pair (Canada–US): the most similar pair in the dataset still differs on 3 out of 4 cited domains.
- 2.8x gap between the most and least localized models: Copilot shares 6.7% of software sources across borders; Grok shares 18.8%. Same prompts, same countries, radically different source strategies.
- 3.6% is the lowest source overlap between any country pair (France–Sweden): two European countries, both asking about the same global software, share fewer than 1 in 25 cited domains.
- 79.5% of US software citations come from .com domains: but even in France and the Netherlands, where .com is lowest, it still accounts for 44–46% of all software sources.
In Saas, Most Sources Are Exclusive to a Single Country
The central finding: when AI models cite sources for global software products, the vast majority of those sources don't appear in any other country's results. On average across all country pairs, each model shares between 6.7% and 18.8% of its cited domains across borders meaning the typical pair of countries disagrees on more than 4 out of 5 sources.
| Model | Avg. Source Overlap |
| Microsoft Copilot | 6.7% |
| Google AI Overviews | 7.9% |
| ChatGPT | 9.5% |
| Grok (xAI) | 18.8% |
These are not niche or culturally specific topics. CRM software, cybersecurity platforms, collaboration tools; the products themselves are global. Salesforce does not become a different product when you cross a border. But the web content AI models draw on to discuss these products is almost entirely different from country to country.
Even Grok, the most global model, shares fewer than 1 in 5 source domains across borders. For Copilot, it's fewer than 1 in 14.
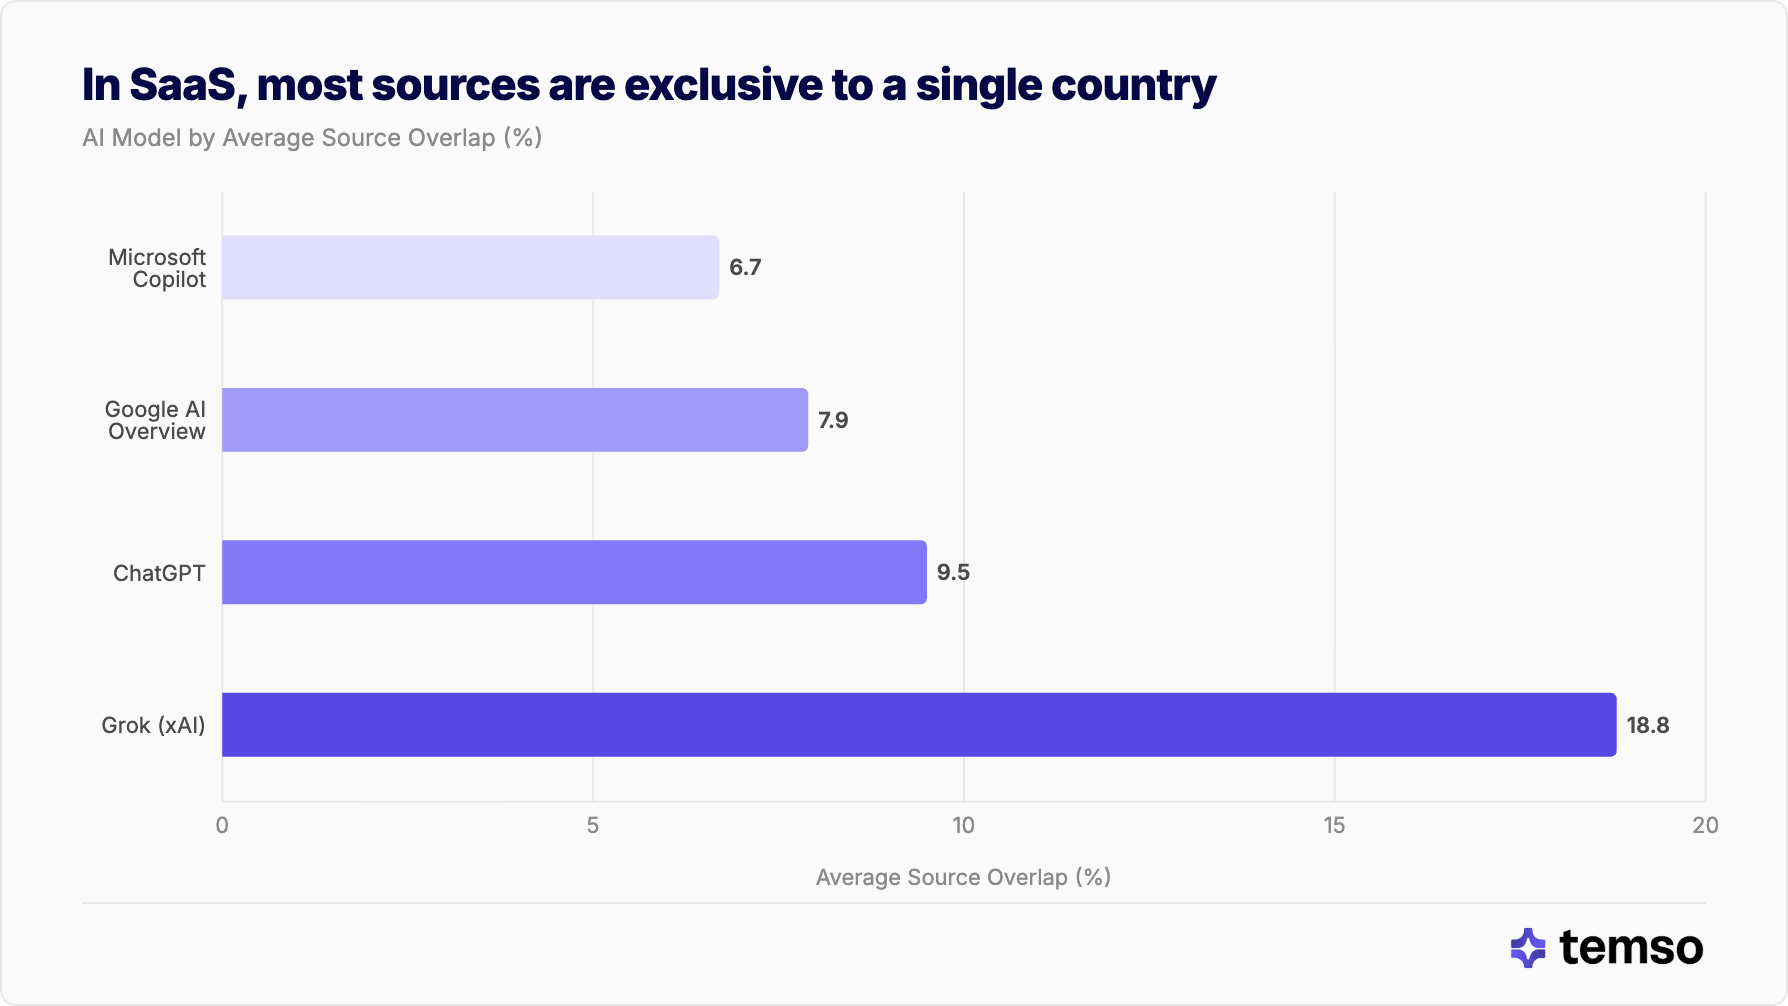
The products are global. The sources AI models cite to discuss them are not.
In SaaS, Language Is the Strongest Driver of Source Similarity
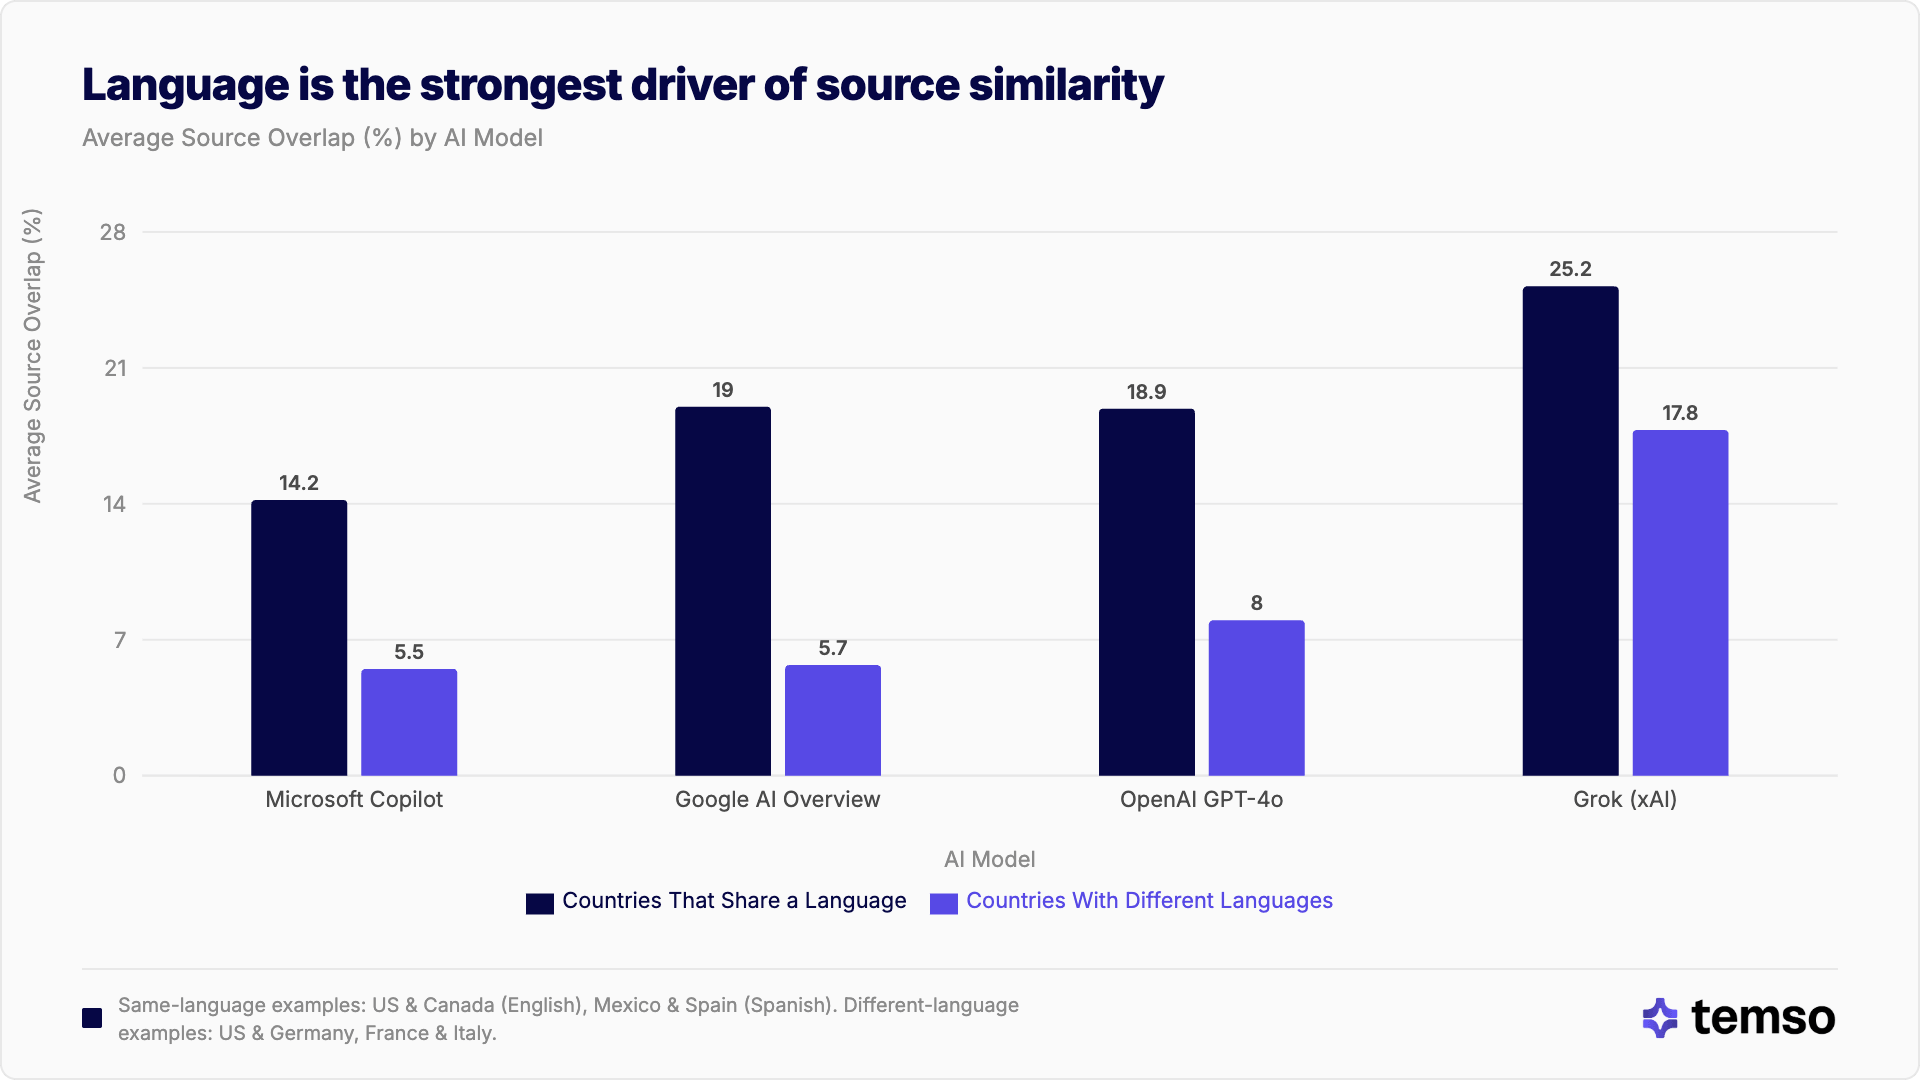
Countries that share a language show dramatically more source overlap than countries that don't. Same-language pairs share roughly 1 in 4 to 1 in 7 software source domains, while cross-language pairs drop to 1 in 6 to 1 in 18.
| Model | Same-language overlap | Cross-language overlap |
| Microsoft Copilot | 14.2% | 5.5 |
| Google AI Overview | 19.0% | 5.7% |
| ChatGPT | 18.9% | 8.0% |
| Grok (xAI) | 25.2% | 17.8% |
All effect sizes are extremely large (Cohen's d > 3.3), confirming that language is the single most powerful predictor of whether two countries will share AI software sources. This holds true even for software which is a category where English-language documentation and reviews dominate globally.
Which Country Pairs Share the Most Sources in ChatGPT?
| Pair | Source overlap | Language |
| Canada - US | 23.9% | English |
| Argentina – Spain | 19.8% | Spanish |
| Australia – Canada | 19.0% | English |
| Argentina – Mexico | 18.8% | Spanish |
| Australia – US | 18.4% | English |
| Spain – Mexico | 17.9% | Spanish |
| UK – US | 17.8% | English |
| Canada – UK | 17.5% | English |
| Australia – UK | 17.3% | English |
Canada and the US lead with 23.9% overlap, the highest of any pair in the study. Proximity and shared language both contribute. But even this best case means that when a Canadian and an American ask about the same CRM software, three quarters of the cited sources are different.
English-speaking pairs and Spanish-speaking pairs perform similarly, clustering between 17% and 24%. The floor for same-language pairs (Australia–UK at 17.3%) is still more than double the average cross-language overlap.
France Is the Most Isolated Market in ChatGPT
Not all countries are equally disconnected. France stands out as the most source-isolated market in the study, sharing the fewest domains with any other country.
The 5 Lowest-Overlap Pairs (ChatGPT)
| Pair | Source overlap |
| France – Sweden | 3.6% |
| France – Canada | 4.1% |
| France – Italy | 4.7% |
| France – Netherlands | 4.7% |
| France – Argentina | 4.9% |
France appears in all five of the lowest-overlap pairs. Its average overlap with other countries is roughly half the overall mean. This reflects the strength of the French-language web ecosystem. French AI models draw heavily from .fr domains and French-language content, creating a source pool that has minimal overlap with any other market.
At the other end of the spectrum, Canada, Australia, and the Netherlands tend to appear as "bridge" countries. They all share above-average sources with multiple language groups, likely because their markets are more exposed to English-language content.
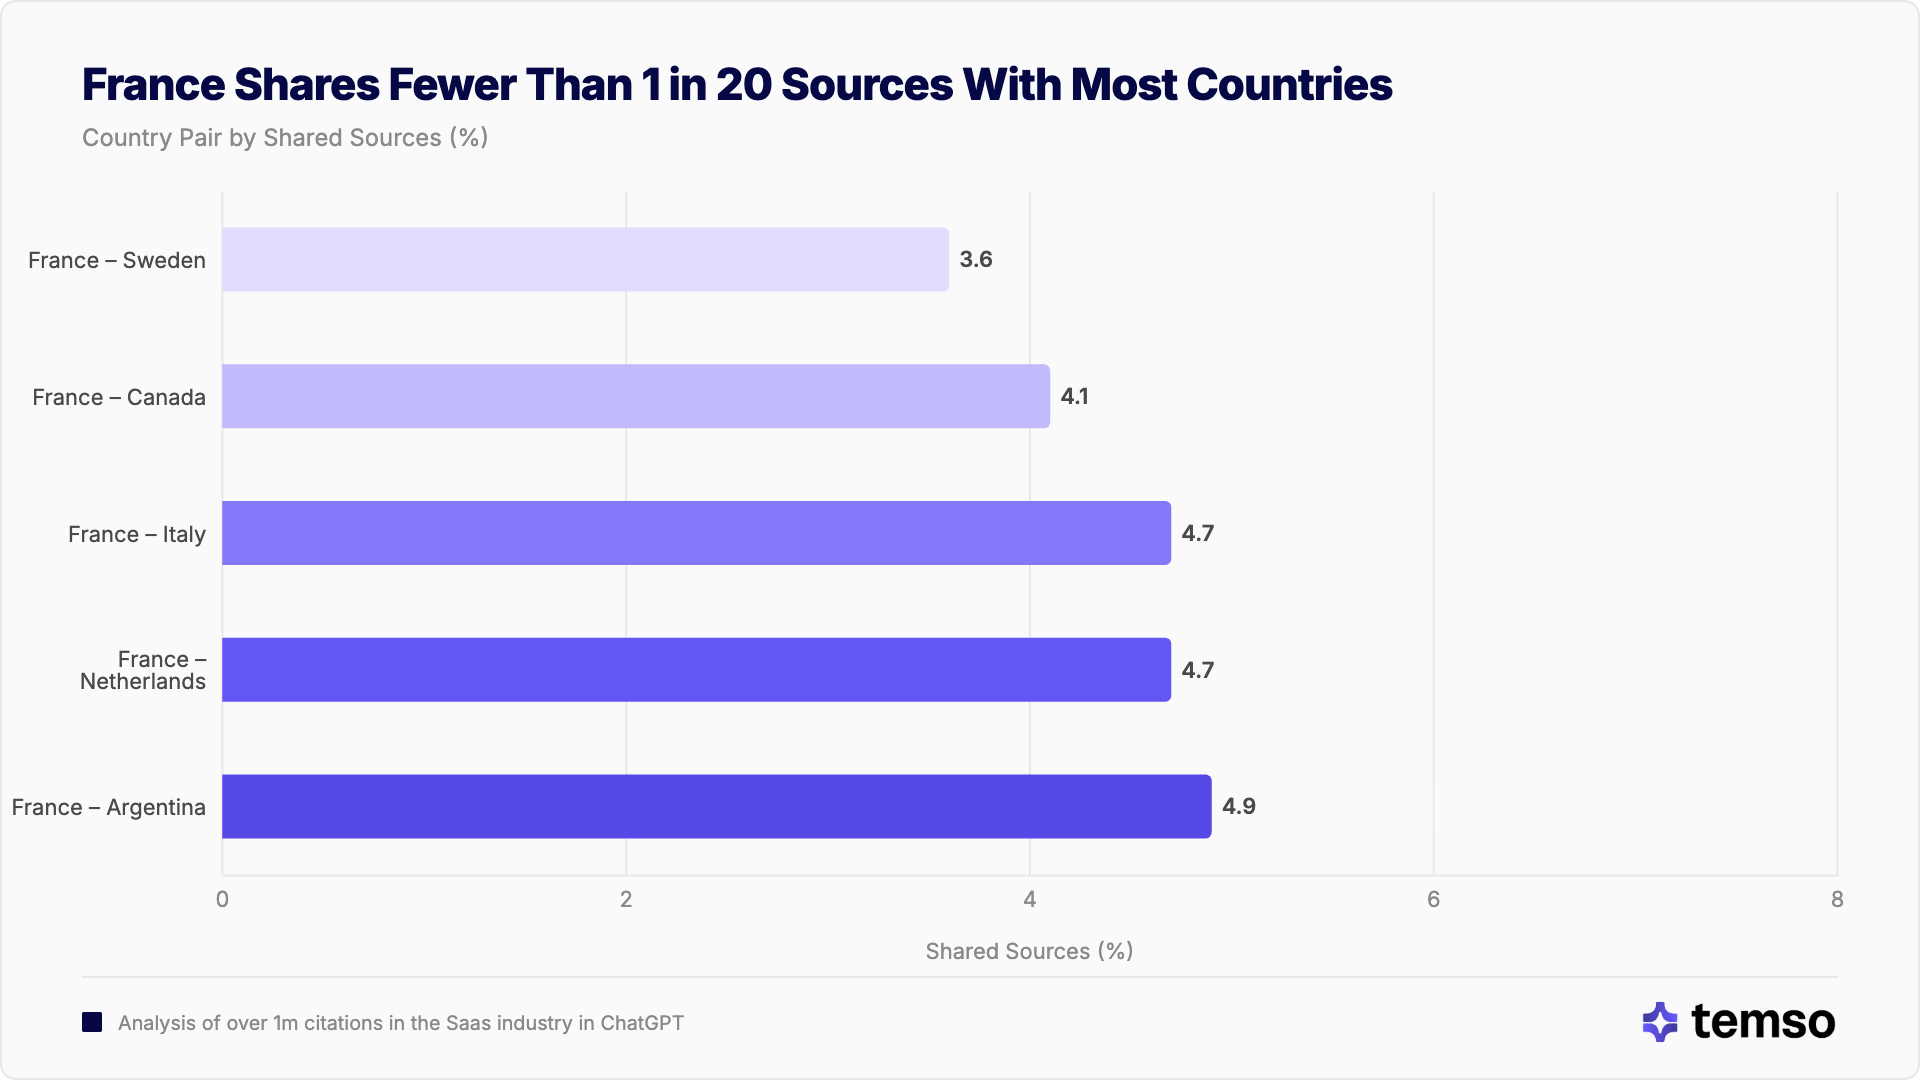
France shares fewer than 1 in 20 software sources with most other countries, the deepest source isolation in the dataset
Regions Don't Behave Like Regions
Many global brands organize their AI and content strategies by region, for example "Southern Europe," "English-speaking markets," "Latin America." The data shows that not all regions are equal. Some are coherent source clusters. Others are a collection of isolated markets that happen to share a border.
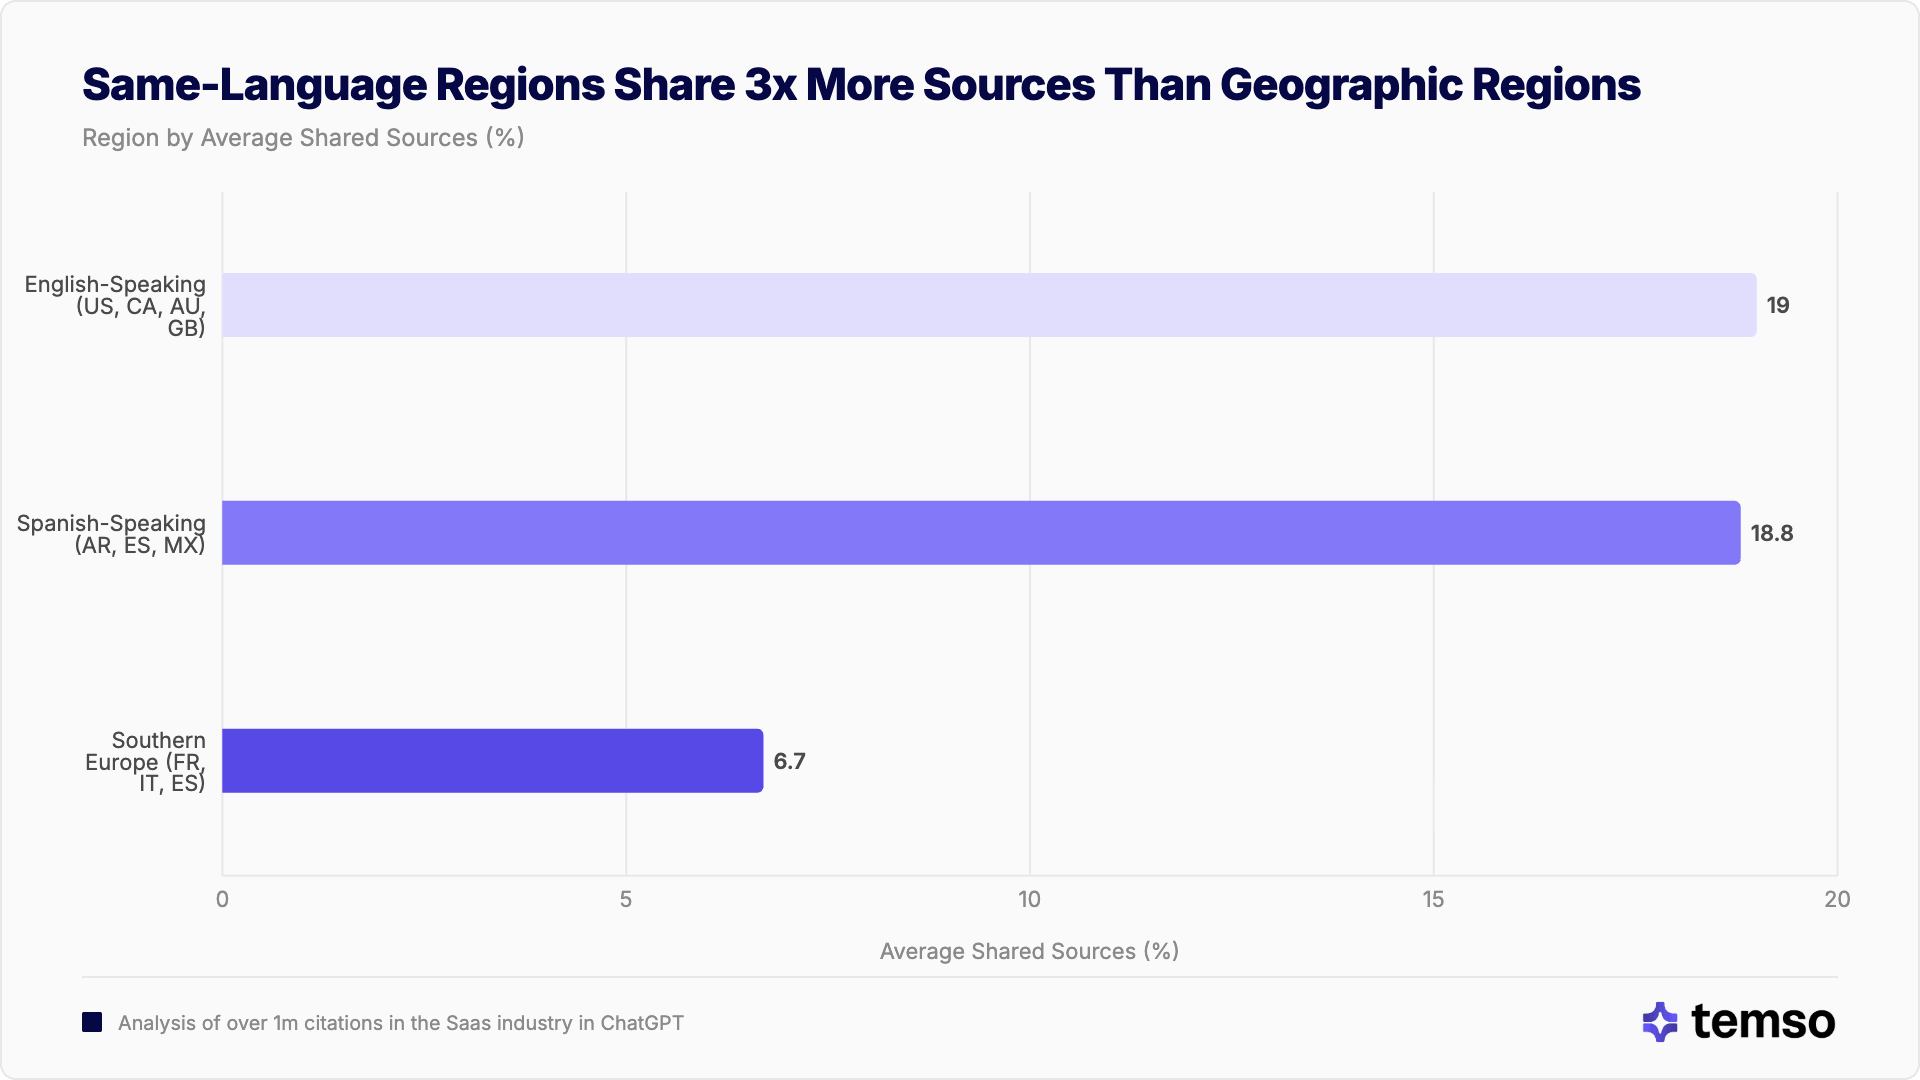
Southern Europe: Three Countries, Three Separate AI Ecosystems
| Pair | Shared sources |
| France – Italy | 4.7% |
| France – Spain | 5.7% |
| Italy – Spain | 9.8% |
| Regional average | 6.7% |
France, Italy, and Spain share an average of 6.7% of their AI-cited software sources. Fewer than 1 in 15 domains in common. These are neighboring countries with closely related languages, shared EU regulatory frameworks, and deeply intertwined economies. In any other context, grouping them makes sense. In AI source visibility, it doesn't.
Each country has built a deep local content layer (39% of France's sources sit on .fr domains, 35% of Italy's on .it, 31% of Spain's on .es) and those local domains are invisible in the other two markets.
Compare That to English-Speaking Markets
| Pair | Shared sources |
| Canada – US | 23.9% |
| Australia – Canada | 19.0% |
| Australia – US | 18.4% |
| UK – US | 17.8% |
| Canada – UK | 17.5% |
| Australia – UK | 17.3% |
| Regional average | 19.0% |
English-speaking countries average 19.0% shared sources. That is nearly 3x the Southern European average. A regional strategy actually has some foundation here. Not because geography connects them, but because a shared language creates a shared source pool.
Each Model Has a Different Definition of "Local"
The four AI models tested show a consistent but dramatic range in how aggressively they localize sources.
Localization ranking (most localized first):
- Microsoft Copilot: 6.7% mean overlap (most country-specific sources)
- Google AI Overview: 7.9%
- ChatGPT: 9.5%
- Grok (xAI): 18.8% (most global, 2.8x more overlap than Copilot)
The Copilot-to-Grok gap is statistically massive (Cohen's d = 3.29). The same prompt, the same countries, the same software products and yet these two models draw from fundamentally different source pools. Grok produces roughly 8x more source citations per response and pulls from a substantially more global set of domains.
This has practical consequences. A domain that ranks highly in Grok's source pool may be invisible to Copilot, and vice versa. Multi-model visibility strategies must account for these architectural differences.
.com Dominates Software Sources, but Local Domains Still Matter
For global software, .com is the dominant domain extension in most markets. But the degree of .com dominance varies dramatically by country, and local country-code domains (.de, .nl, .se, .fr) still account for a significant share of citations in many markets.
.com Share by Country
| Country | .com share |
| US | 79.5% |
| Canada | 62.3% |
| Mexico | 59.4% |
| Argentina | 55.4% |
| Sweden | 55.0% |
| Spain | 54.3% |
| UK | 54.1% |
| Australia | 50.6% |
| Italy | 49.4% |
| Germany | 49.1% |
| Netherlands | 45.8% |
| France | 44.5% |
.com is the majority source in 10 of 12 countries. Only France and the Netherlands hold below 50%. This reflects the reality that most enterprise software content including vendor sites, review platforms, comparison articles lives on .com domains.
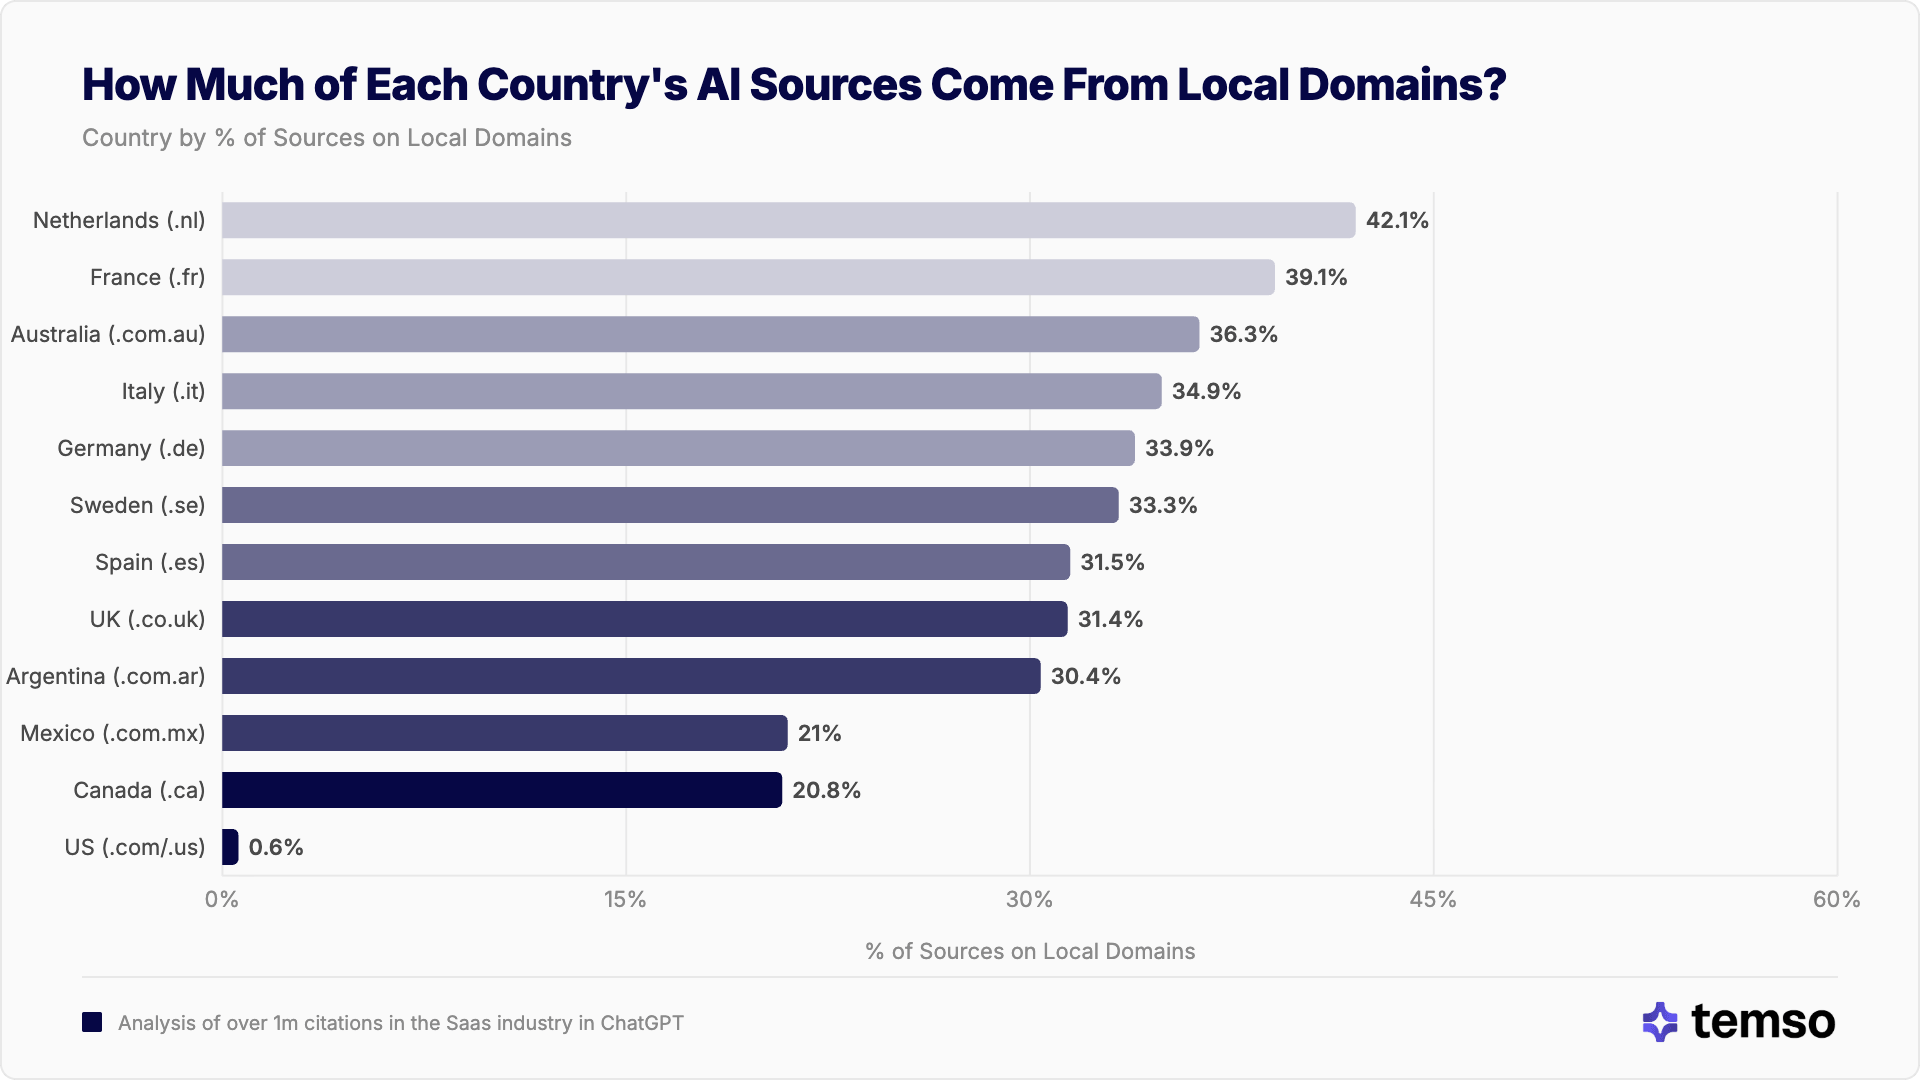
Local Country Code Two Letter Domain (ccLTD) Share by Country
| Country | Local ccTLD Share |
| Netherlands (.nl) | 42.1% |
| France (.fr) | 39.1% |
| Australia (.com.au) | 36.3% |
| Italy (.it) | 34.9% |
| Germany (.de) | 33.9% |
| Sweden (.se) | 33.3% |
| Spain (.es) | 31.5% |
| UK (.co.uk) | 31.4% |
| Argentina (.com.ar) | 30.4% |
| Mexico (.com.mx) | 21.0% |
| Canada (.ca) | 20.8% |
| US (.com/.us) | 0.6% |
Even for software, local domains account for 21–42% of citations in non-US markets. The Netherlands leads at 42.1%, meaning nearly half of all software sources cited to Dutch users live on .nl domains. This is striking for a global topic and explains why source overlap across borders remains so low. Each country's AI models draw from a deep pool of local-language, local-domain content that simply does not appear in other markets.
Even for global software, local domains account for up to 42% of AI citations, a hidden layer of the web that doesn't cross borders.
The Full Picture: Country-by-Country Source Overlap
The heatmap below shows pairwise source overlap between all 12 countries for ChatGPT on software prompts. Language clusters are clearly visible: warm blocks for English-speaking countries (AU, CA, GB, US) and Spanish-speaking countries (AR, ES, MX), surrounded by cooler cross-language cells.
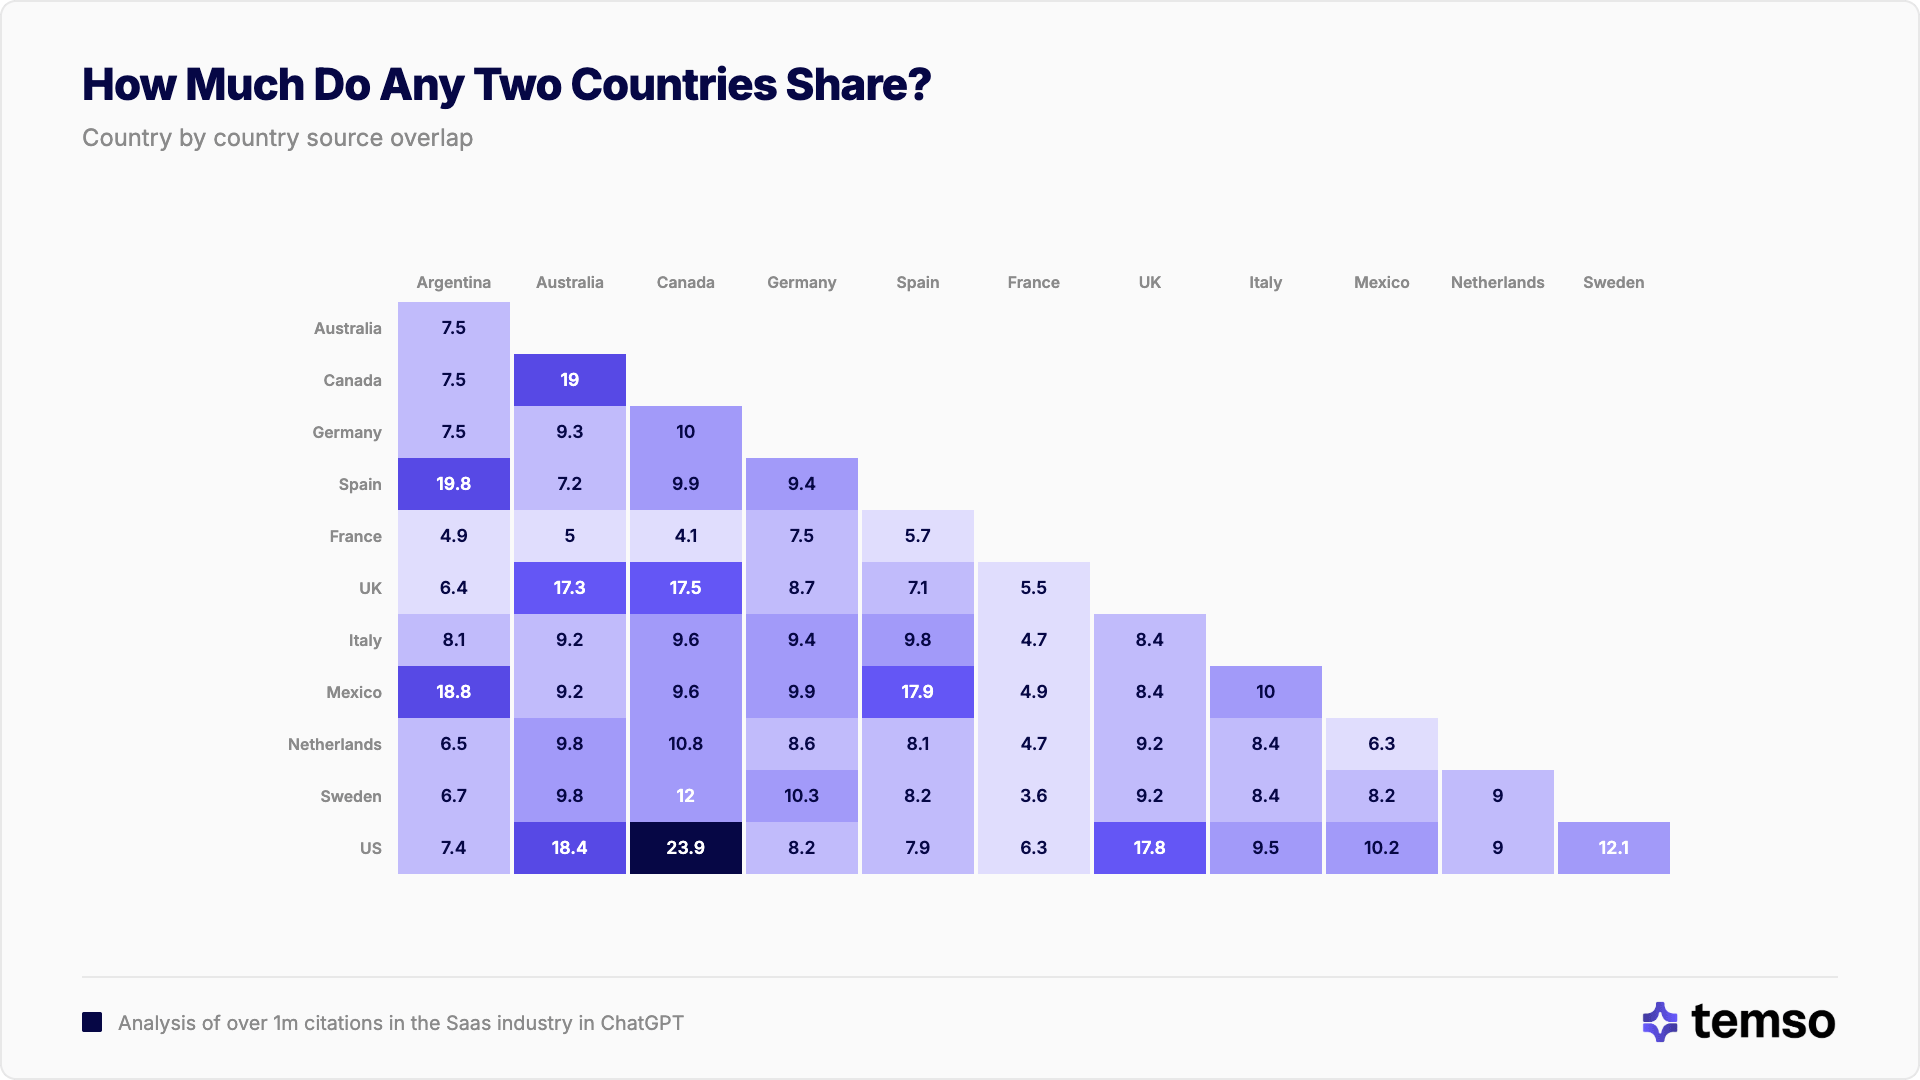
The heatmap reveals a layered structure: language islands sit within a cooler sea of cross-language overlap. France (FR) is consistently the coldest row, its sources are the most isolated from every other market. Germany, Italy, the Netherlands, and Sweden occupy a middle band, sharing more with each other (8–10%) than with linguistically distant markets, but far less than same-language pairs.
Methodology of the Study
We selected six software and technology prompt groups that cover inherently global topics: CRM, cybersecurity, marketing automation, data analytics, collaboration tools, and AI agents. No prompt in any of these groups references a specific location. This ensures that any source divergence reflects country- and language-level effects, not the local nature of the topic itself. We used Temso AI's powerful monitoring capabilities to gather and analyze high-quality information.
For each AI model, we collected the full set of unique website domains cited in each country's responses, then measured pairwise overlap using Jaccard similarity which is the percentage of shared domains out of all domains cited in either country. We computed this for every pair of the 12 countries, then compared same-language pairs against cross-language pairs to measure the language effect.
Statistical significance was assessed using Cohen's d for effect sizes and 95% confidence intervals on all mean estimates. All comparisons exceed the minimum sample size threshold of 30 pairs per group.